Cloud Native C10
Kubernetes Cloud Native Monitoring with TICK & Prometheus - Up and Running

Note (May 2026): This article uses Helm v2-style commands and older Helm stable charts, including the historical
stable/prometheus-operatorchart. Modern clusters typically use Helm v3,kube-prometheus-stack, updated Fluent Bit/Prometheus/Grafana charts, and newer CRD/API versions. Treat the architecture ideas as reference and update the installation commands before applying them today.
0 Introduction
This post does not intend to introduce Prometheus or InfluxDB. It serves as a reference for building a monitoring/logging system in Kubernetes with open-source software.
The monitoring/logging/alerting system consists of four open-source software components. Refer to the diagram below.

- Fluent Bit is used for log collection. Fluent Bit is deployed as a Kubernetes DaemonSet to all Kubernetes nodes. It collects container logs and enriches them with metadata from the Kubernetes API.
- InfluxDB is used to store collected/enriched logs from Fluent Bit.
- Prometheus is used for monitoring. It pulls metrics from service monitoring targets and stores metrics in its own time-series database.
- Grafana is used for metrics analytics and visualization. It serves as a dashboard system.
1 Prerequisites
The whole deployment requires Helm, charts, and a few customized configuration files. Follow the steps below to download them in advance.
1.1 Helm
Refer to Install applications with Helm in Azure Kubernetes Service (AKS) to install Helm.
1.2 TICK Charts
Clone TICK charts from the repository below.
git clone https://github.com/influxdata/tick-charts.gitTICK stands for
- T - Telegraf
- I - InfluxDB
- C - Chronograf
- K - Kapacitor
1.3 Monitoring Configuration Files
Download the Kubernetes monitoring configuration files from the repository below.
git clone https://github.com/huangyingting/k8smon.git2 Install/Configure TICK Stack & Fluentbit for Logging
2.1 Install TICK Stack
From command prompt/shell, change directory to tick-charts(cloned from section 1.2)
helm install --name data --namespace tick ./influxdb/ --set persistence.enabled=true,persistence.size=16Gi,config.udp.enabled=true

helm install --name alerts --namespace tick ./kapacitor/ --set persistence.enabled=true,persistence.size=8Gi

helm install --name dash --namespace tick ./chronograf/

helm install --name polling --namespace tick ./telegraf-s/
2.2 Configure InfluxDB UDP Port
The default setting of InfluxDB is incorrect for UDP service, so we need to change the protocol from TCP to UDP with the steps below.
kubectl edit service data-influxdb -n=tick
Modify
  - name: udp
    port: 8089
    protocol: TCP
    targetPort: 8089
To
  - name: udp
    port: 8089
    protocol: UDP
    targetPort: 8089
2.3 InfluxDB Configuration
From command prompt/shell, run kubectl port-forward svc/dash-chronograf -n=tick 8080:80
Open a browser and access http://localhost:8080, then follow the wizard and set:
- InfluxDB address to http://data-influxdb.tick:8086
- Kapacitor address to http://alerts-kapacitor.tick:9092
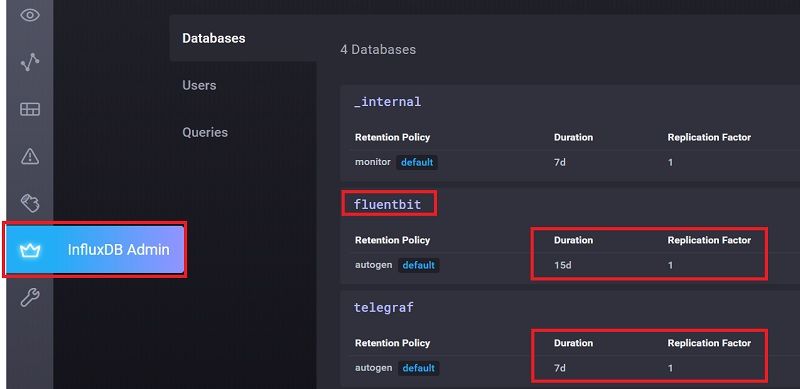
From “InfluxDB Admin”, create two databases called “fluentbit” and “telegraf” with the settings below.
2.4 Install Fluentbit to Collect Container’s Log
Fluent Bit is a lightweight log collector. According to Fluent Bit:
Fluent Bit is an open source and multi-platform Log Processor and Forwarder which allows you to collect data/logs from different sources, unify and send them to multiple destinations. It’s fully compatible with Docker and Kubernetes environments. Fluent Bit is used here to collect and populate Kubernetes container logs into InfluxDB. To install it into Kubernetes, change directory to k8smon.
kubectl create namespace logging
kubectl apply -f fluentbit-config.yaml
kubectl apply -f fluentbit-ds.yaml
2.5 Verify Log Collecting
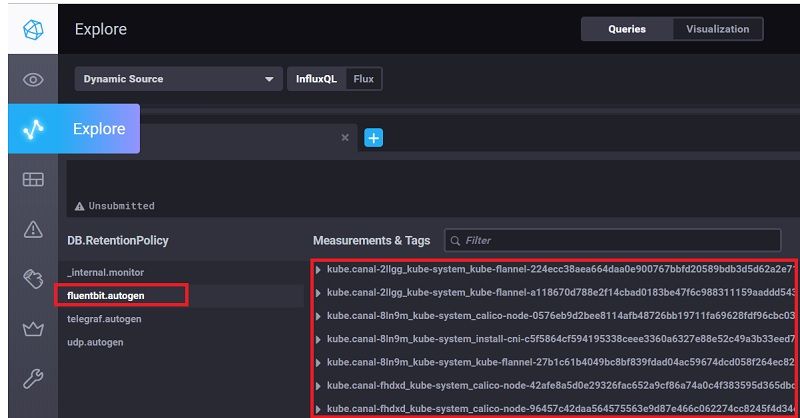
Fluent Bit should start collecting container logs and storing them in InfluxDB. To verify it works properly, go to Chronograf “Explore” and highlight the “fluentbit” database. It should list container measurements as shown below.
3 Install/Configure Prometheus for Monitoring
Prometheus is an open-source systems monitoring and alerting toolkit originally built at SoundCloud.
We choose Prometheus Operator because it has a set of preconfigured dashboards and alerts.
3.1 Install Prometheus Operator
Change directory to k8smon, then from command prompt/shell, run
helm install --name prom --namespace prom stable/prometheus-operator -f prometheus_values.yaml3.2 Configure ETCD Monitoring
Newer Kubernetes clusters should have SSL/TLS enabled for etcd, and Prometheus needs a client certificate to monitor etcd. For example, in a kubeadm-based cluster, the client certificate, client key, and CA certificate are in the master node’s /etc/kubernetes/pki/etcd directory. Copy/rename the CA certificate to ca.crt, the etcd client certificate to etcd.crt, and the etcd client key to etcd.key, then create a YAML file with the following commands.
cat <<-EOF > etcd-client-cert.yaml
apiVersion: v1
data:
  etcd-ca.crt: "$(cat ca.crt | base64 --wrap=0)"
  etcd-client.crt: "$(cat etcd.crt | base64 --wrap=0)"
  etcd-client.key: "$(cat etcd.key | base64 --wrap=0)"
kind: Secret
metadata:
  name: etcd-client-cert
  namespace: prom
type: Opaque
EOF
And apply it to the Kubernetes cluster.
kubectl apply -f etcd-client-cert.yaml
3.3 Configure Controller Manager and Scheduler Monitoring
Monitoring the Kubernetes controller manager and scheduler requires them to listen on the 0.0.0.0 address. If Kubernetes is deployed with kubeadm, we need to change the following settings and then reboot the master node.
sed -e "s/- --address=127.0.0.1/- --address=0.0.0.0/" -i /etc/kubernetes/manifests/kube-controller-manager.yaml
sed -e "s/- --address=127.0.0.1/- --address=0.0.0.0/" -i /etc/kubernetes/manifests/kube-scheduler.yaml
3.4 Configure Telegraf Output to Prometheus
We’d like to use Prometheus to collect InfluxDB’s metrics and have InfluxDB monitored by Prometheus. Unfortunately, InfluxDB doesn’t expose its metrics to Prometheus. However, Telegraf can collect InfluxDB’s metrics and output them to Prometheus, so we can configure Telegraf to transmit InfluxDB metrics to Prometheus. To do that, change directory to tick-charts, then run the following from a command prompt or shell.
helm upgrade polling --namespace tick ./telegraf-s/ -f ../k8smon/telegraf_values.yaml3.5 Verify Monitoring
Prometheus should start to collect metrics, to verify it works appropriately, from command prompt/shell, run
kubectl port-forward svc/prom-prometheus-operator-prometheus -n=prom 9090:9090Now, open a browser and visit
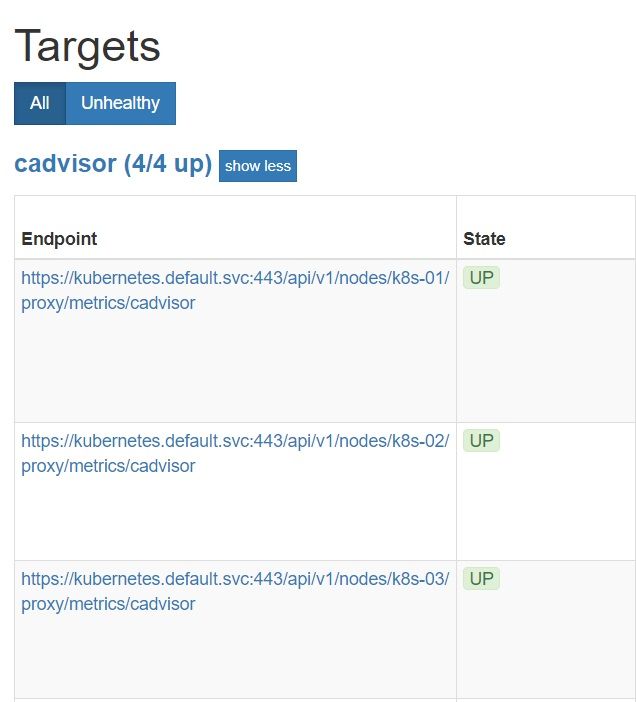
http://localhost:9090/targets
All targets should be green.
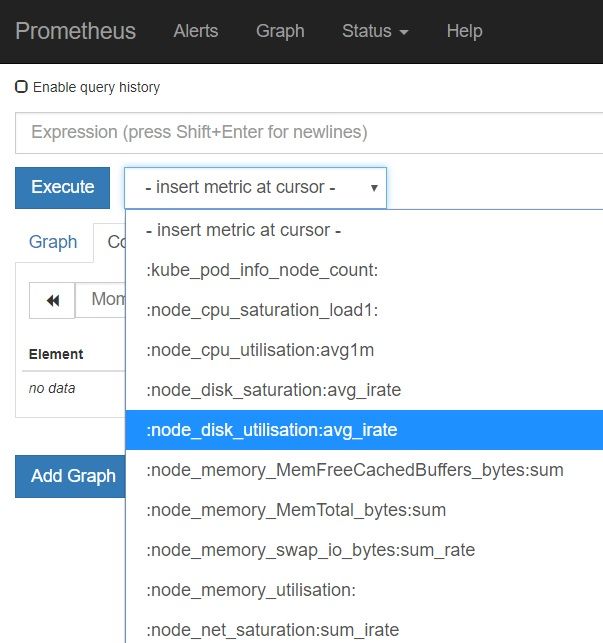
Also, when accessing http://localhost:9090/graph, all metrics should be populated.
4 Alerting
Refer to Alerting overview
Alerting with Prometheus is separated into two parts. Alerting rules in Prometheus servers send alerts to an Alertmanager. The Alertmanager then manages those alerts, including silencing, inhibition, aggregation and sending out notifications via methods such as email, PagerDuty and HipChat.
The default configuration in prometheus_values.yaml will redirect alerts to a null notification channel.
  config:
    global:
      resolve_timeout: 5m
    route:
      group_by: ['job']
      group_wait: 30s
      group_interval: 5m
      repeat_interval: 12h
      receiver: 'null'
      routes:
      - match:
          alertname: Watchdog
        receiver: 'null'
    receivers:
    - name: 'null'
To enable sending alerts to MSTeams, we can
- From prometheus_values.yaml, comment out above configurations and uncomment below part
    route:
      group_by: ['alertname', 'job']
      group_wait: 30s
      group_interval: 1m
      repeat_interval: 12h
      receiver: 'prometheus-msteams'
      routes:
      - match:
          alertname: Watchdog
        receiver: 'prometheus-msteams'
    receivers:
    - name: 'prometheus-msteams'
      webhook_configs:
      - send_resolved: true
url: 'http://prometheus-msteams.prom:2000/alertmanager'- Run
helm upgrade prom --namespace prom stable/prometheus-operator -f prometheus_values.yamlto update the settings - Clone prometheus-msteams with
https://github.com/bzon/prometheus-msteams.git - From MSTeams, correct a webhook for a channel, then open values.yaml, set alertmanager to webhook URL
connectors:
- alertmanager: https://outlook.office.com/webhook/xxx/IncomingWebhook/xxx/xxx- Run
helm install --name prometheus-msteams ./prometheus-msteams --namespace promto install prometheus-msteams
If it is configured correctly, you should be able to receive alerts from prometheus in MSTeams
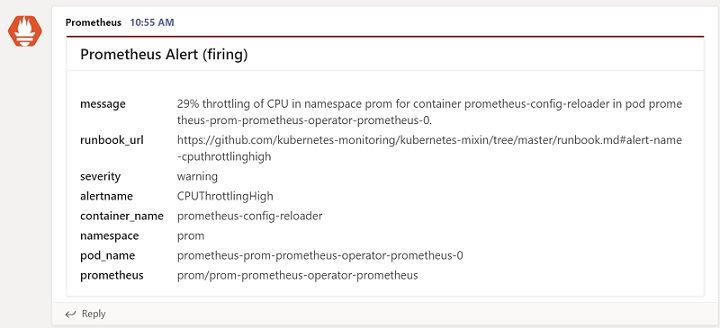
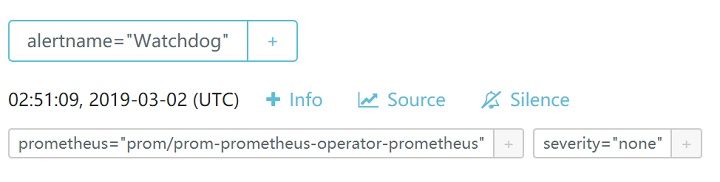
Prometheus has an alert manager to review all alerts, it can be accessed with
kubectl port-forward svc/prom-prometheus-operator-alertmanager -n=prom 9093:9093
Then open a browser to http://localhost:9093/#/alerts
5 Grafana
The default setup will install a few preconfigured dashboards into Grafana. To access those dashboards, we need to log in to Grafana first.
- Follow the steps below to get the username/password.
kubectl get secret -n=prom prom-grafana -o jsonpath="{.data.admin-user}"|base64 --decode;echo
kubectl get secret -n=prom prom-grafana -o jsonpath="{.data.admin-password}"|base64 --decode;echo- Run
kubectl port-forward svc/prom-grafana -n=prom 18080:80, open a browser to access http://localhost:18080/login, and log in with the username/password retrieved from step 1. - From “Home”, find those preconfigured dashboards.
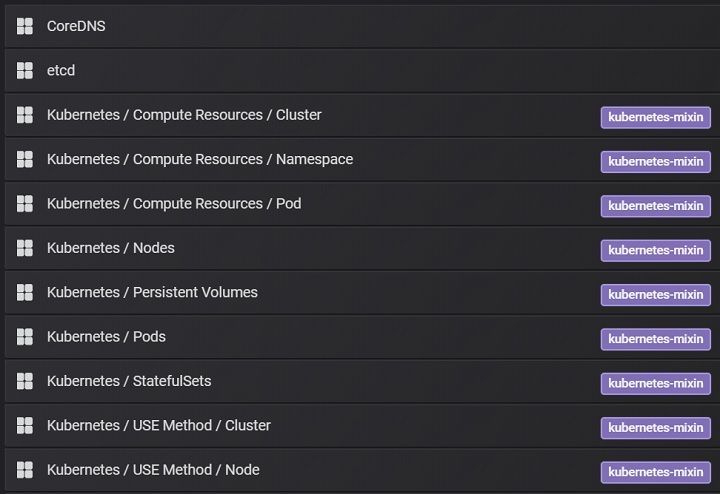
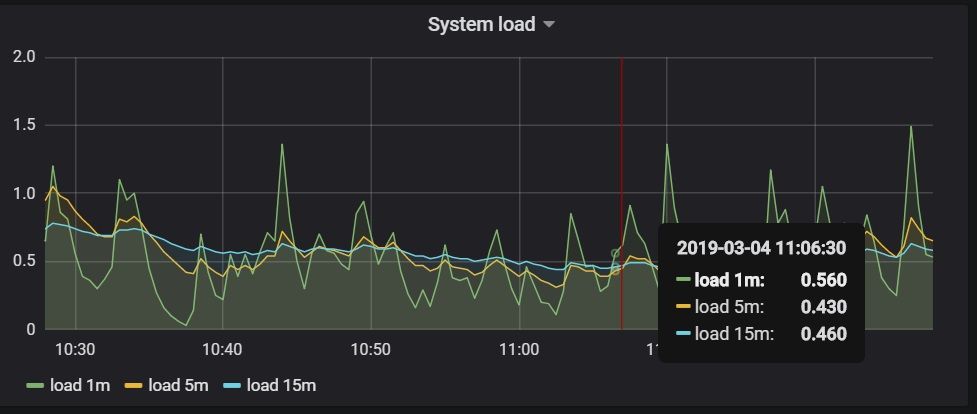
- Click any of them, for example “Node” dashboard will list all performance metrics
6 Summary
The setup above should get monitoring/alerting/logging up and running for the Kubernetes cluster. This solution could also be applied to a small or mid-sized self-hosted Kubernetes cluster.